Showing posts with label DYJS. Show all posts

Monday, February 26, 2007

DYJS: Giant Data Set of Doom

Thank you all for patiently waiting on what has proved to be a monstrous undertaking by the folks at Immaculate Inning: the compilation of Did Your Job Stat for the whole Wild Card Era. We are indebted to retrosheet.org for their publicly available linescore data. The project is facilitated by Xenod (who wrote a program to parse the data and spit out a CSV file) and myself (who arranges the data in various configurations till something interesting leaps out). Agent Swag provides mostly moral support, intelligent questions, and the occasional cookie.

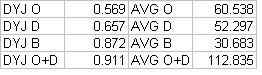
Anyway, onto the data. To refresh, the core of Did Your Job Stat is measuring consistent performance on a day-to-day basis. What this means for baseball teams is that on a given day, scoring four or more runs means the offense Did Their Job; they put the team in a great position to win. Similarly, if the pitching can limit the team to four or fewer runs, they've Done Their Job. We now have data for every team from 1993-2006, and the results are still encouraging. First, we have four statistics that measure a team's ability to Get the Job Done. "DYJO" and "DYJD" correspond to the percentage of games in which the offense scores 4 runs or the pitching (defense) allows 4 or fewer runs. "DYJB" is the percentage of games in which the team does both Jobs. I also like to look at "DYJ O + D" which is adding the first two metrics together- while highly correlated to DYJB, I think it shows ability throughout the whole season rather than just during a game. Speaking of correlations, this table explains how each stat is correlated to team winning percentage:

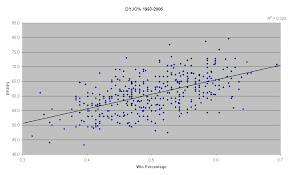
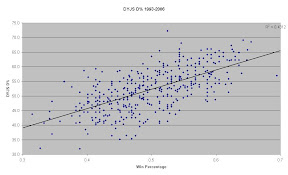
The first set of values is the correlation coefficient, or "r." A value of r that is greater than zero means a positive correlation (as wins go up, DYJS also goes up). Based on my knowledge of similar studies, r-values of greater than 0.35 are considered significant. For comparison, the correlation of Runs Scored to wins in 2006 was r = 0.65. So DYJS continues to have excellent correlation to regular season winning percentage . For a more graphical view of the above, consult the following graphics:
From DYJS Graphics
From DYJS Graphics

While in the statistical realm such a graph might be referred to as "Shotgun," I believe that the trendline is real and is significant, particularly for pitching. One direction this analysis could take would be to identify some of the extreme outliers and examine these potentially interesting teams. For example, the 1993 Atlanta Braves had an unusually low DYJO% of 55.6%. Yet they won 104 games. Why? Because Greg Maddux, John Smoltz, and Tom Glavine led an extraordinary pitching staff to a DYJD% of 69.1%, second overall in our entire data set.

A primary goal of creating any statistic is to make top 10 lists for your new stat. So here we go, the top 10 teams in all four statistics since 1993:

One thing that kind of jumps out is the high percentage of teams from 1994 that appear on this list. The strike-shortened season did indeed produce two teams with winning percentages greater than .700 (Expos and Yankees), but I cannot be sure whether there was not some effect from not playing games in September (For example, do the "callups" who frequently play in September Get the Job Done less frequently?). I will answer this and other questions in future posts. I would also like to adjust for the year, since the number of runs scored in 1993 is not the same as in 2006; nor is the average DYJS, I'm guessing. I will also try to normalize for home park factors, as suggested by poster Kiffy in the last DYJS post.

Finally, we're working on making the data more flexible, so that we can play with the measure of Doing Your Job. As a poster at WasWatching pointed out:


in reality, the yanks would have to score more than the leage average in runs
per game, and allow less than that. as far as i can tell, the average number of
runs per team per game, last year was 4.857. so when doing this analysis it is
important to remember that when the offense score 5, it is less valuable to the
team than when the pitching/defense allows 4. also it is easy to say the
pitching didn't do their part, because it is easy for the offense to score the
extra ~0.14 runs, as opposed to the offense preventing the extra ~0.84 runs.

This does make sense, and we are hoping to bring more data into the fold that can measure DYJS with a score of 5 or 3, or whatever we wish. Finally, because I'm a Yankees fan, here's a look at how the Yanks have performed in DYJS since 1993 (maybe I'll add more teams later). The teams are arranged by their DYJ O+D score:

Friday, February 16, 2007

More Team DYJS Stat Goodness coming soon

I just finished writing up a program to take the game logs straight off the retrosheet website and process them. I'll be passing the data off to mehmattski for analysis who should have some nice charts/graphs sometime over the next day or two.


The information used here was obtained free of
charge from and is copyrighted by Retrosheet. Interested
parties may contact Retrosheet at "www.retrosheet.org".

Tuesday, January 30, 2007

Diving into DYJS Data, Part 1

First of all, welcome to all those who may have wandered over from waswatching.com, after Steve graciously linked to me tonight. Now that I've introduced DYJS, I thought that I'd post some interesting preliminary findings. The goal when I set out on this giant mission of data gathering, was to find new correlations to October success. I'm going to need more than six teams' worth of data (the 2006 playoff teams) to get that far, so for now I'd like to look at how well DYJS explains 2006 regular season success.

First of all, from the data summary, it seems that runs scored per game relates to wins at r=0.62. To explain, using my (admittedly limited) knowledge of statistics- a team's aggregate offensive output "explains" 62% of a team's win total. An r value of 1.00 means the two variables (in this case W and RS/G) would completely "explain" each other, while 0.00 would mean that there was no relation between the variables. Many of BP's regular season stats , when compared to post-season success, had an r value close to 0.00. Anyway, I'd like to use this 62% value as a benchmark for seeing how well each of the metrics I've co-created relate to wins.

Standard deviation of runs scored on a day-to-day basis was the original aim of this story. And as I pointed out in the previous post, the Yankees did lose to a team with a lower standard deviation of runs scored. However, here's where my statistics knowledge can get me into trouble, because I know just enough to make bad conclusions. What I'm wondering is what the effect of not being able to score fewer than zero runs has on the overall picture. What I mean is, does the Tigers' lower standard deviation come from the fact that they scored fewer runs, overall, than the Yankees. Any help from real statisticians would be appreciated.

In regards to the DYJS, the number that immediately jumps out at me is 0.89. That is the correlation between "DYJS O + D" and wins. What that means is the number of times that a team is able to Do Their Job at the plate and on the mound goes a long way towards explaining the number of wins a team accumulates. This seems intuitive to me, but I co-invented the statistic, so maybe it isn't so for others. At any rate, I think it shows me that I am on the right track with this metric, since it's so closely related to wins.

Looking specifically offense and defense, I find that Doing Your Job on the mound correlates much better to wins (r = 0.71) than does Doing Your Job at the plate (r = 0.59). To look at this another way, I've ranked each team in its DYJ percentage on offense and defense. The teams are ranked by wins, and I've compared each teams' rank in wins to its DYJS ranks:


So, what I believe this is telling me is that in the 2006 American League, it was much more important to Do Your Job on the mound than at the plate. In fact, for the Yankees it was crucial: there were 115 games when the Yankees Did Their Job at the plate in 2006, and they won 87 of those games (that's where the 75.7% comes from). On the mound, however, they Did Their Job in 79 games and won 67 of them (84.8%).

In the near future, then, I'm going to take a close look at my numbers for pitching, rather than offense, because I believe I am pushing toward the following conclusion: In terms of regular season success, the ability to keep the opposing team from reaching 5 runs in any given game was a crucial aspect of win total. More to come....

Using Team DYJS

Following the collapse of the Yankees in the 2006 Division Series, there was much discussion over at my favorite Yankees site (Bronx Banter) about What Went Wrong. More than a few fans began to rebel at what is considered the “new wave” of team construction- signing players with high on base percentages, focusing on scoring as many runs as possible, limiting traditional tactics such as stolen bases and sacrifice bunts. These fans were not at all satisfied with the response of the “statheads” to postseason performance, typified by Billy Beane’s comment: “My shit doesn’t work in the playoffs.”

Indeed, research conducted by Baseball Prospectus has produced reams of material showing the statistical correlations between regular season wins and on base percentage, slugging percentage, and other more complicated stats. It was these correlations that lead to philosophies of team building made infamous by Moneyball. But, as in all statistics, sample size matters. The long-term trends of a 162 game schedule cannot be compressed into the do-or-die environment of the best-of-five series.

Baseball Prospectus also investigated this, using a system they developed to measure post-season success. Simply put, a team gets maximum points if they sweep all eleven games and win the World Series, and minimum points for getting swept out of the division series. Using this formula, they tried to correlate post-season success with their metrics known to correlate well with regular season success: runs scored, runs allowed, on base percentage, pitchers’ strikeout rate, and many more. What they found is not one metric correlated with post-season success in any meaningful way. Perhaps the post-season really is a crapshoot.

Or is it? Another poster, who also has an excellent blog, and I started to toss around the idea that because the long-term trends do not apply does not mean that there are no trends at all. Offensive production surely is not tied to winning in October: the 2006 Yankees scored 933 runs, but went 21 straight innings without scoring a run in the Division Series. Therefore, the question is this: in terms of post-season success, perhaps what matters more than having a productive offense is having a consistent offense. I have no formal training in statistics (which should change in the next year or so), but to me the way to find this out was investigating the standard deviation of runs scored on a day-to-day basis. Looking at this graphically, here’s the 2006 Yankees:


The graph is vaguely bell-shaped, but there are some clear outliers: the Yankees scored exactly 3 runs in a game significantly more than is predicted by normal distribution, and allowed 2 runs a lot as well. Overall, the Yankees averaged 5.72 runs/game, with a standard deviation of 3.68. How does this compare to the team which knocked the Yanks from the playoffs? The Tigers averaged fewer runs per game (5.07) and with a smaller standard deviation (3.39). Here’s the Tigers’ run distribution:


So is it true that the Tigers had a more “consistent” offense, and that’s why they were better equipped to win in the small-sample environment of a Division Series? Well, I’m not sure. As I said, I’m not a statistician, and I would welcome the assistance of one for this data. In the meantime, this looks like a perfect use for Did Your Job Stat. As I hinted in the comments to Sam’s original post, DYJS originated not out of individual performance, but of that of a team. How often did the Yankees’ offense “do their job” and score at least five runs in a game? How often did the Yankees’ pitching “do their job” and limit the opposition to four or fewer runs?

Thanks to retrosheet.org and a parsing program written by Sam, I was able to collect this data for all MLB teams from the 2006 season. The results are very, very interesting and I will not try to say it all in one post. However, you can view the summarized data here. In the coming days and weeks I’ll try to dissect this data (as well as historical data from previous seasons) to determine what it is that DYJS can tell us about a team’s success in the regular season and the post season.

Friday, January 19, 2007

The Did Your Job Stat(DYJS)

Baseball is a game immersed in statistics, moreso than any other sport. A diehard football fan would be hard pressed to name his quarterback's completion percentage or even be aware of how a Quarterback rating is calculated. When Rex Grossman has a QB rating of 0.0, we all know that it's bad, but we have very little idea on how it's calculated. Basketball only really has ppg, free throw percentage, and field goal percentage as far as casual stats go. Other stats exist of course, but even the well known stats aren't regular topics of conversation outside of Shaq's abysmal free throw percentage.

Baseball on the other hand is a completely different animal. Pitch counts are religiously followed by broadcasters with 100 being the magic number for when a pitcher is "done". If he throws 75 pitches he was underworked, 150 and the manager is going to kill his arm. A .300 batting average is the gateway between a good season and a great season at the plate. If you Win 19 games as a pitcher you had a good season, but if you win 20 games in a season people will refer to you as a 20 Game Winner for the rest of your life. Win 300 games in your career and you're automatically in the Hall but 288, not so much.

Even casual fans are aware of BA, OBP, ERA, Slugging, Wins/Losses, and OPS. More hardcore fans know such stats as BB:K, fielding percentage, groundball/flyball percentage, etc. Beyond this there are numerous more derivative statistics such as Win Shares and VORP.

Stats can be used to compare hitters to hitters and pitchers to pitchers, but there's no easily understandable stat to compare hitters and pitchers. VORP and Win Shares can be used but you practically need a phD in math to understand them, making them far outside the grasp of the actual fan. Enter the Did Your Job Stat(DYJS).

DYJS represents the percentage of the time that a player made enough of a contribution to help his team win. In any game that a player participates in he either Did His Job, or He Didn't.

A hitter can do his job by getting 2 Job Points in a 9-inning game. Job points are awarded as follows.
+1 getting on base safely
+1 getting a RBI
-1 commit an error
-.5 grounding into a double play
+.5 successful sac bunt
+.5 successful steal
-.5 unsuccessful steal

So, if you hit a homerun you did your job for the game since you "got on base" and got an RBI. Under this system, hits and walks are obviously equivalent if the bases are empty. If a player commits 2 errors in a game, he has severely hurt his team on defense and needs to have an outstanding day at the plate in order to make up for it. A pinch hitter or sub does his job if he has .5 or more Job points.

The metric for a starting pitcher is inspired by the idea of a quality start. Wins and losses are too arbitrary to truly measure a pitcher's performance. Only 2 things matter for an AL pitcher in whether he did his job, Earned Runs and Innings pitched. For every inning beyond the 6th, the pitcher is allowed an extra half-run, rounded down. So, he can't Do His Job if he allows 4 runs unless he completes the 8th inning. A NL pitcher can further help his cause by getting on base or getting a RBI and will be allowed to give up an extra .5 runs(rounded down). So, when Dontrelle Willis hits a grand slam(like he did against the Mets last year), it allowed him to give up an extra 2.5 runs in order to do his job. As far as grounding into double plays/bunting, this is considered normal for a pitcher either way.

This leads to the question about relievers. A reliever can do his job if he allows no runs if he has less than 2 IP. This includes inherited runners, because the job of a reliever is to get out of the inning, regardless of the situation he is put in. Relievers, in general, aren't as skilled as starters, so if they get extended work they're allowed to give up a run sooner than a starter. Closers are treated the exact same way as other relievers. Saves are nice for the stat book, but giving up 2 runs in a single inning is not a good thing regardless of the result.

I cannot say for sure without actually running some numbers if this will produce DYJS averages for good batters and good pitchers, but that's the idea. If it does not, I'll either have to re-tune the numbers or accept the idea that hitter and pitcher consistency cannot be compared. Good players should contribute to their teams success consistently.

The really cool thing about the concept of DYJS is that it can be applied to anything. Think of it as a Statistic Interface that can be implemented by anyone familiar with an activity. Take my job for instance. There are way too many kinds of tasks for me to give a score to, but as a sample, lets say I need to get 2.5 DYJS points to do my job for the day(and yes I realize that only me and perhaps Jeff have any idea what I'm talking about).
+1 fix a bug(on average anyway. some are more complex than others)
+1 full deployment to QA
+.5 push rules to QA
-.25 forget to turn on Rule debug after giving new code to Dev environment
+.25 fix a minor problem for someone(point out the "user error")
-1 a program that I maintain breaks and it takes me longer than 10 minutes to fix it, and it's caused by something being wrong in it initially and not the environment changing

For someone like a surgeon, he'd probably need 1 DYJS point to do his job and it'd look something like this.
+1 show up to work
-1 screw up

Using this metric, you could certainly compare a surgeon to a middle reliever, although I'd hope that the surgeon would have a DYJS % in the high 90's and would dominate any middle reliever. This suggests the idea of an Employment Adjusted Did Your Job Stat Perentage(EADYJS %), but that is a topic for another day.